After running the Advanced Demand Forecast Program, you can retrieve visual results using the Advanced Demand Forecast Analysis. The analysis provides the results for each selected for product or line and the selected methods.
You can use this information to study the difference between the demand calculated by the current method compared to the demand that would be used with other forecast methods and if the advanced demand forecast is a more viable or reliable solution. you can use the table display that Eclipse provides, or graph the forecast or sales options, to review the information more closely.
You can run the forecast programs and display this information based on the last forecast that was run. After running your demand program, the system alerts you that the program is complete. You can then review the latest information through the Advanced Demand Forecast Analysis window.
Note: Eclipse uses the closest Saturday before the day when the report runs. The system considers the As of Date (that Saturday) to be the Date Last Calculated from the audit window. Therefore the Date Analyzed field matches the date the report runs.
Important: If the seasonality test of a product fails without returning an ACF score or if a product has less hits than the minimum hits to test seasonality as defined in the Advanced Demand Forecast Parameters control maintenance record, then the system calculates a standard demand forecast. Meaning, no advanced demand forecast calculations are made on the product. You can check this information by using the audit screen in Primary Inventory Maintenance. |
To analyze your demand forecast methods:
From the Maintenance menu, select Product to display Product Maintenance.
In the Product field, enter the product or line you want to review.
From the Inventory menu, select Primary Inventory Maintenance.
From the Edit menu, select Advanced Demand Forecast Analysis.
Use the Inquiry menu to do one of the following:
Display weekly and monthly calculated values for the selected product in the selected branch.
Display the Product Sales History.
These options display in new windows.
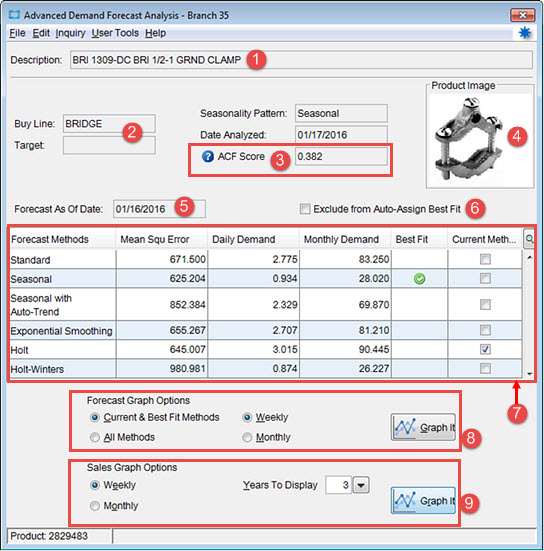
The Analysis window is broken into sections so you can see at-a-glance what your current forecast method looks like compared to what is determined a best fit, or other forecasting methods.
Important: Using the Exclude Negative Quantities From Item Demand Calculations control maintenance record will eliminate any negative quantities, but does not eliminate the system actually calculating a negative demand. This means if you use Holt or Holt-Winters and your sales have actually gone down over the specified period, the system will show a negative demand. |
Following are the sections and options available in the Advanced Demand Forecast Analysis window:
Number / Section |
Description |
1 |
Description of the product for which you have run the Advance Demand Forecast. |
2 |
If running for a product, the Buy Line the product is contained in, indication if you have the product marked as seasonal, the current Vendor Target, and the date the product was analyzed. |
3 |
ACF Scores. Auto-correlation Function. Displays visually how the seasonal and non-seasonal scores were determined. For more information, see About ACF Scores below. |
4 |
Product image, if available, as entered in the product maintenance file. |
5 |
The Saturday date for the last full week of sales. |
6 |
Option to exclude the product when the update forecast method selected calculates demand based on when Eclipse forces the Advanced Demand Forecast best-fit analysis. |
7 |
For each forecast method, both current and advanced, the system displays the following values:
|
If a row displays as blank, that forecast method was not selected to calculate demand in the Advanced Demand Forecast setup parameters. |
|
8 |
Graphing options for the selected forecast methods. Select from the following:
|
9 |
Graphing options for the selected sales. Select from the following:
|
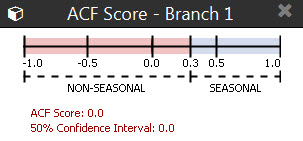
The auto-correlation function (ACF) displays visually how the seasonal and non-seasonal scores were determined. Calculating your seasonal items is vital to maintaining your warehouse stock. While forecasting is never perfect, the ACF scores helps you see how Eclipse has calculated your seasonal products to you can better plan and prepare.
The ACF chart represents time spans depending on how you have the Advanced Demand Forecast Parameters control maintenance record parameters set.
The graph provides a visual to see where in the seasonality spectrum your products are falling. You can then address the Advanced Demand Forecast Parameters, if you feel that the results are not accurate.
To view the ACF score:
From the Maintenance menu, select Product to display Product Maintenance.
In the Product field, enter the product or line you want to review.
From the Inventory menu, select Primary Inventory Maintenance.
From the Edit menu, select Advanced Demand Forecast Analysis.
Next to the ACF Score field, click the question mark icon to display the graph.